What if I told you that, based on the data, the video game you should make should be: a well-written, BLANK, BLANK game where the hero is a BLANK BLANK villain who likes BLANK?
Curious to read more? Well, you should be. Your first hit indie game might be inspired by what you read here today…
What is Steam?
Launched in 2003 by Valve Corporation (makers of Half-Life, Counter-Strike, Portal, Dota), Steam is the leading PC gaming distribution platform in the world. In 2021, Steam generated over $10 billion in revenue and hit 132 million Monthly Active Users (MAU). According to Variety, Valve has over 1 billion registered user accounts.
Steam has become the premier distribution platform not just for AAA and AA titles, but also for titles made by indie game developers from all around the world. After opening up its platform to indie developers in 2013, the Steam library now has over 70,000 titles, with another ~1000 new titles launched every month. It recently celebrated its 20th anniversary.
Steam’s only notable competition in this space is Epic Games Store, which only recently opened its platform up to indie game developers. It remains to be seen if Epic will catch up to Steam’s dominance, or whether Steam is too well-entrenched to be truly challenged.
How to decide what game to make?
For an indie game developer (whether you’re part of a small team or solo), Steam is a goldmine of information. Despite not having the clout, budgets, resources, or brand recognition of AAA games studios, there have been many indie game developers that have achieved significant financial (and critical) success on Steam. A few notable examples include:
- Terraria
- Spelunky
- Papers, Please
- Undertale
- Firewatch
- Stardew Valley
- Hollow Knight
- Cuphead
- A Short Hike
- Vampire Survivors
Every month brings opportunity for a new indie game to catch fire with Steam’s users. But as an indie game developer, how do you choose what game to make? Do you just make what you love, or is it worth considering what Steam users actually like to play?
The answer to those questions, to some extent, lies in insights we can glean from the data.
For the purposes of this article, I am basing my analysis on a Kaggle data set pulled from Steam’s API by Martin Bustos on April 3, 2023. I have used a combination of SQL and Tableau to clean and analyze the data, as well as create the visualizations. For examples of my SQL code, please see the Appendix at the end of this article.
There are some great insights in this article about the number of releases per year, most common price points, review ranges, genres, and tags. There are even some insights about what happens when you release more than just one game.
There’s also some secret sauce I’ve added to all the above that might give you a different perspective to other analyses you may have seen on other websites.
But before diving into all that, it’s important to mention what my data analysis approach involved.
Analysis approach – A focus on review numbers
The data Steam makes available via their API does not contain sales figures (such as number of sales, revenue generated, wishlists, etc). There are other websites (such as this one) that attempt to estimate these sorts of figures, usually through some combination of number of reviews, price points, signals from other websites and sources, and ultimately their own proprietary algorithms that take all this info together and apply some combination of weightings and multipliers (with fancy names like “the boxlieter method”). But even then, this is not a precise science. Additionally, price points are constantly fluctuating through various sales events (and currency changes!), so that complicates matters further.
For the purpose of my analysis, I am greatly simplifying this entire approach. Thankfully, Steam does make review numbers available, so it’s a safe assumption that if players like a game, that game is likely to have reviews. And the more reviews (regardless of positive or negative sentiment), the more likely that game sold more copies.
Of course, not every player will leave a review. And perhaps different types of players might be more inclined to leave reviews on different types of games. But at the end of the day, reviews are still the best way to determine if a game is successful. After all, a Steam user cannot leave a review if they have not purchased and played the game they want to review.
So it makes sense to make a game that Steam users are likely to review.
The secret sauce – Technical complexity
There is one specific approach I have used in analyzing Steam data that I don’t see others doing.
As an indie game developer, it’s not enough to know what game to make to increase your chances of success. That game also has to be feasible to make.
As indie video game developers, our major strength is our agility. We can move quickly. We can make decisions on the spot. We can change our mind. Often. We can constantly test and iterate. We can wear many different hats. And we (usually) don’t need to spend time aligning various stakeholders. We can just focus on execution. Because ultimately, that’s the only thing that will matter.
However, the weakness most of us have is that we simply do not have the time, resources, capabilities, scale, funds, brand reputation, or marketing power to make the types of games AAA publishers do.
Instead, we need to be very ruthless with our time and scope, and ride a fine line between optimism and pessimism. If we’re blindly optimistic, we’ll try to bite off more than we can chew – and probably never finish making our game. On the other hand, if we’re too pessimistic we might think all of this sounds too challenging to begin with, so why even try.
So the answer for most of us indie game developers is to focus on creating games that are less technically complex to develop. Maybe as our skills and success grow, we can eventually make games that are more complex – but that day is not today.
Which games are less technically complex?
Steam’s data set includes a field called “Categories”. It’s perhaps not the most descriptive name, but what this field actually contains is a list of technical features that a particular game has.
Using my own knowledge and experience of game development, I decided to label each of these categories as either complex to make, or not complex. Here’s what I came up with:
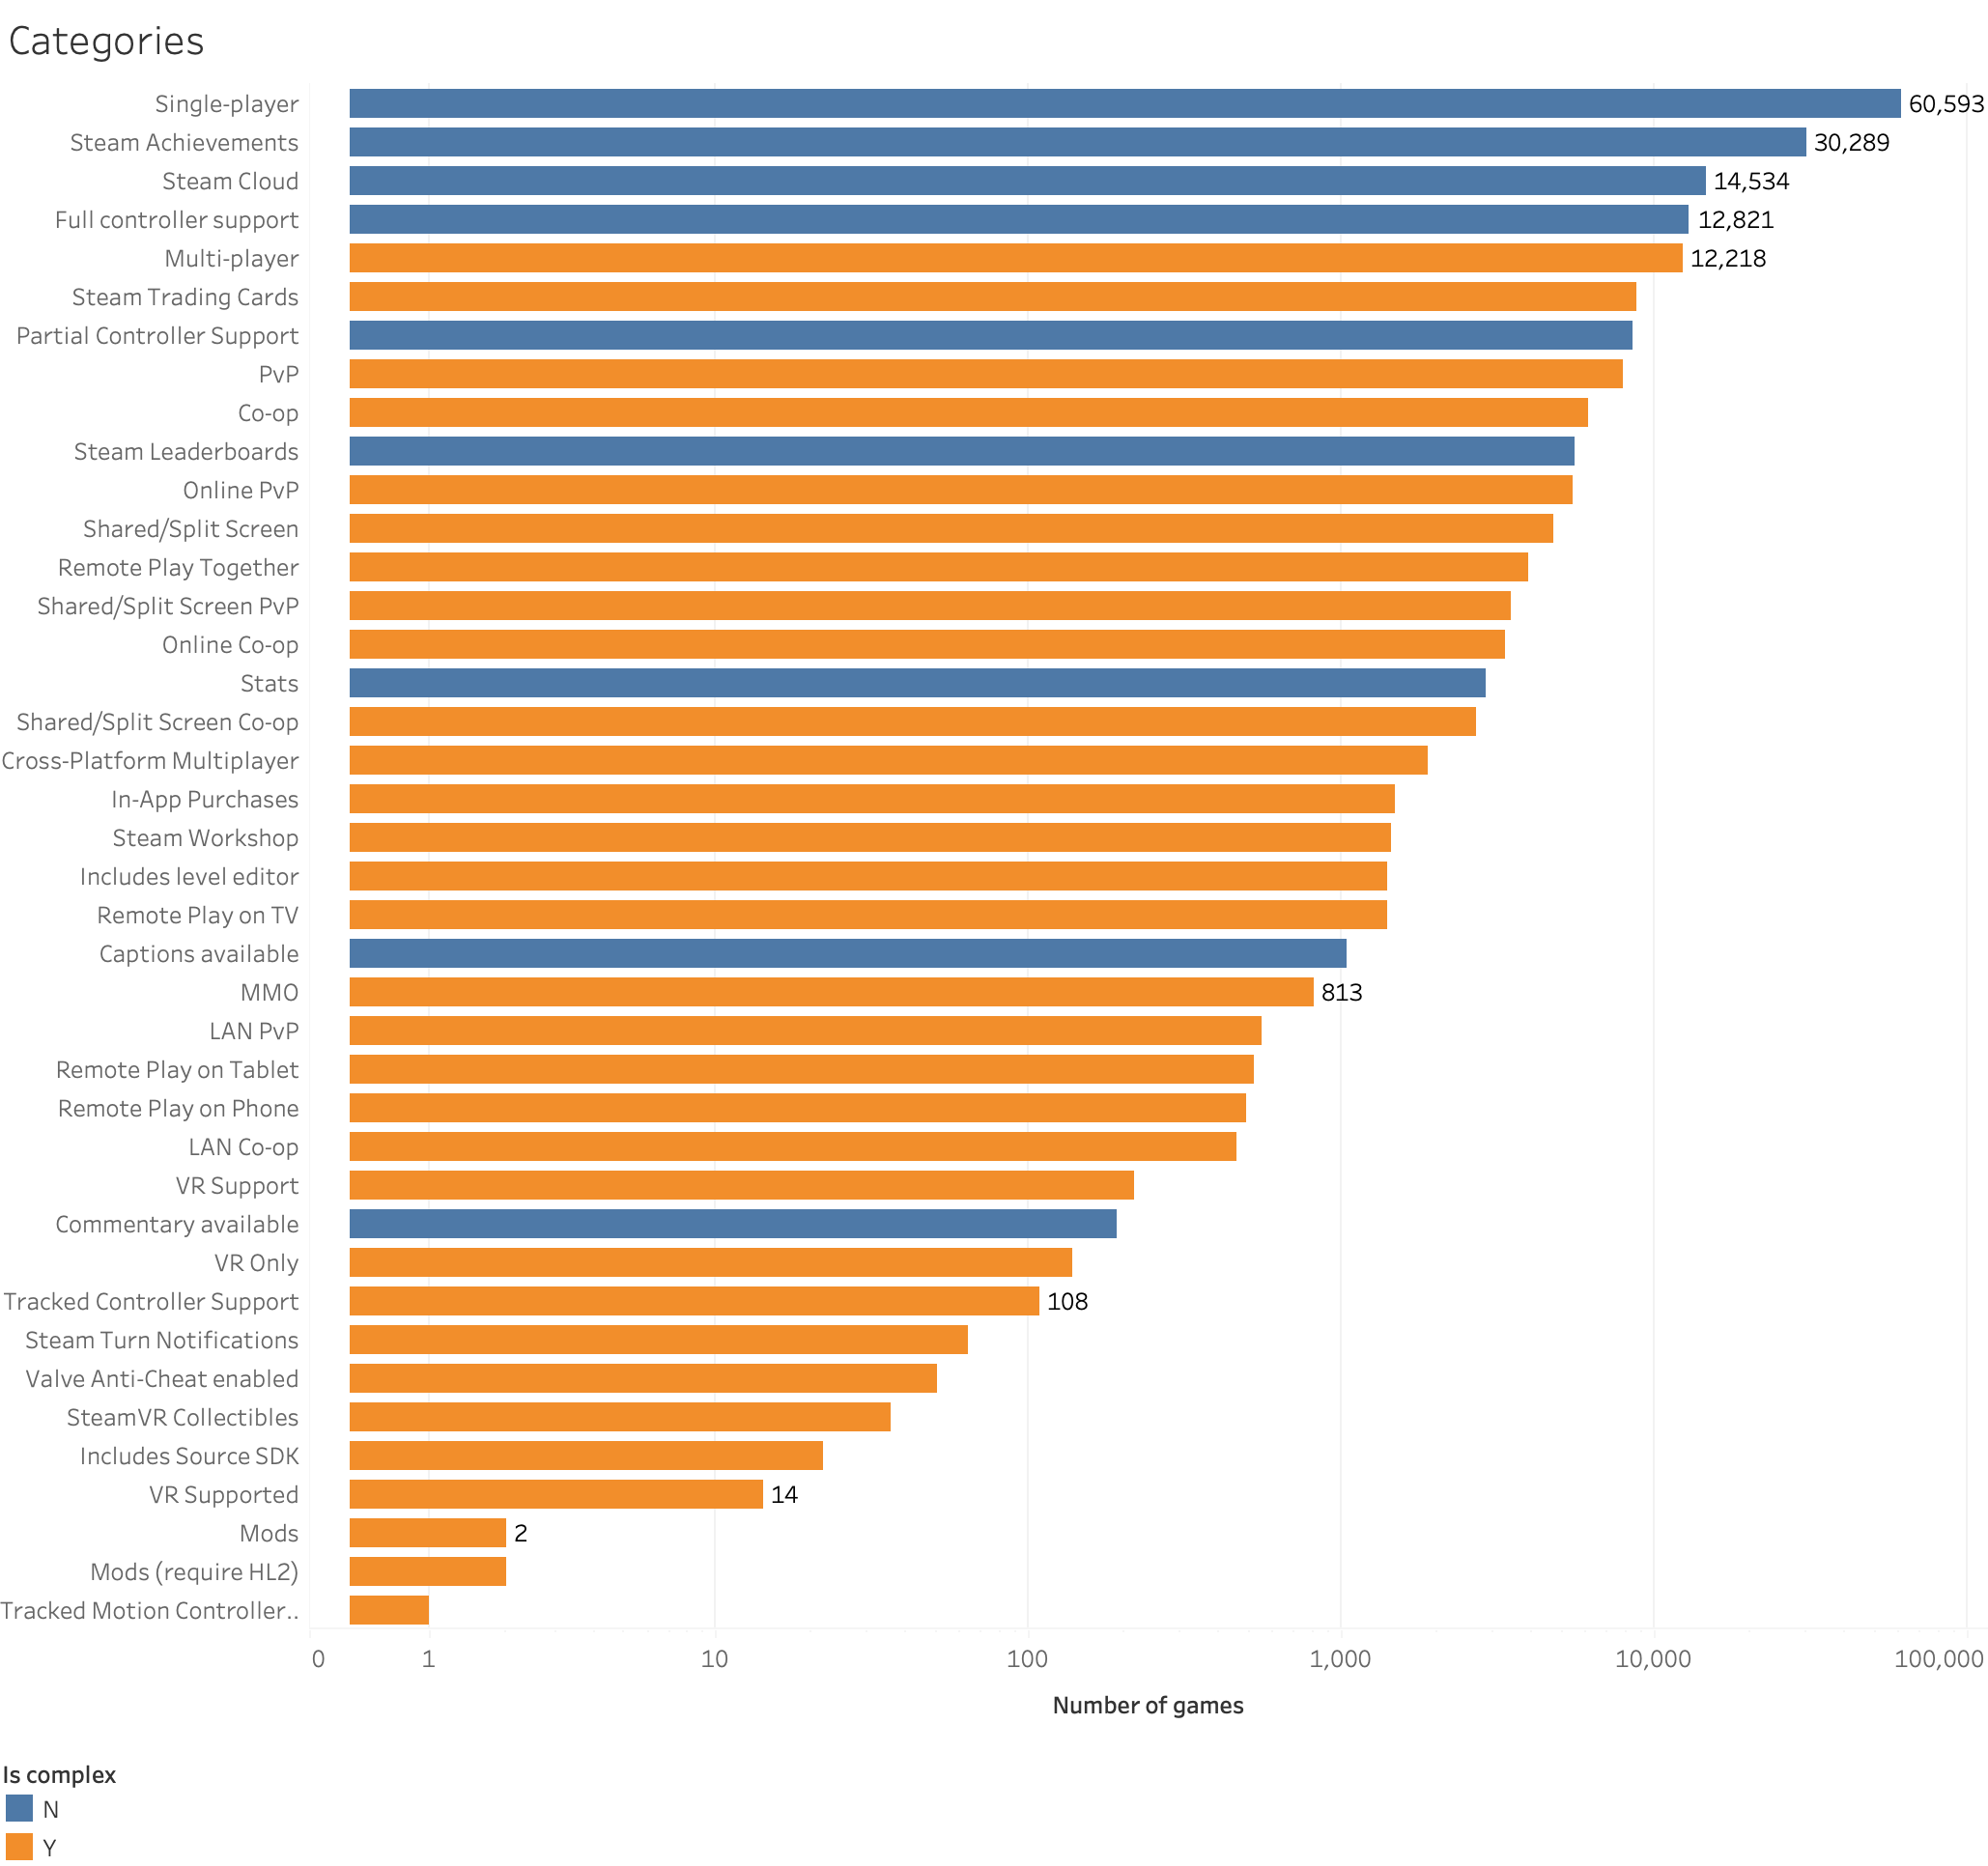
(Note the above is on a logarithmic scale)
Using this approach, I then labelled a game as complex to make if it contained any of the orange categories above. (Surprisingly, doors didn’t make an appearance…)
But not surprisingly, many of these orange categories revolve around multiplayer functionality.
Of course, this labelling approach isn’t perfect:
- It’s biased towards what features I believe are complex (and it’s possible I might be a terrible developer).
- Games labelled as non-complex based on the above could still have been complex to make for other reasons.
- Additionally, like with all this data, it still relies on developers and publishers properly categorizing the data to begin with.
But overall this unique analysis approach gives us a much better idea, on average, which games are actually feasible to make as an indie game developer.
Excluding AAA publishers
Continuing from the above, I also put together my own list of publishers I consider to be AAA. These are usually major companies (often multi-billion-dollar ones). We don’t want their games heavily skewing this data analysis.
It can be difficult deciding which publishers should be excluded in this way, so if you’re interested to see which ones I chose to exclude, see the Appendix at the end of this article.
For now, I decided to keep games made by AA publishers (these are smaller than AAA and often publish games made by indie game developers). There is, of course, an argument to exclude AA as well, but in reality some indie game developers will succeed in getting a publisher for their games, so it might be worth including this data. Also, games by AA publishers tend to be much smaller in scale and scope compared to AAA publishers.
But, as with any data analysis, there is no perfect approach. There is no one right answer. What we’re looking for is an idea of what is most likely to be useful.
Time for the fun stuff!
But enough talk. Let’s get to the fun stuff – the visualizations and what they mean.
The big picture
With the previously mentioned exclusions in mind, just how many games are in the Steam library?
Like Keanu Reeves, you’re probably thinking… woah. And you’d be right. At the moment, there are approximately 1000 new games released on Steam every month. That’s more than 1 game released every hour.
Note with the above animation that if we apply my complexity secret sauce, we can see that the number of complex games released seems to be relatively consistent every year.
It’s the number of less complex games that are skyrocketing every year. And that’s not surprising. Thanks to the democratization of game development in recent years (free tools and resources are more advanced and accessible than ever), more people are making games than ever.
So as an indie game developer, you’re not just competing with the 1000 other games released this month. You’re also competing with the thousands of other games that have already been released, plus the 1000 games per month that will be released in future too! Holy data points, Batman!
Shut up and take my money!
Most of us are probably aware that the mobile game market is dominated by the free-to-play business model. While that wasn’t the case when smartphones and the first app stores were launched over a decade ago, that’s the reality now. And that’s what happens when there are over a million games in mobile app stores, and smartphone users are used to getting things for free. Convincing anyone to pay up-front for a mobile game in that kind of environment is a tough ask.
But you’ll be relieved to know that the opposite is true on Steam. The vast majority of games on Steam are paid.
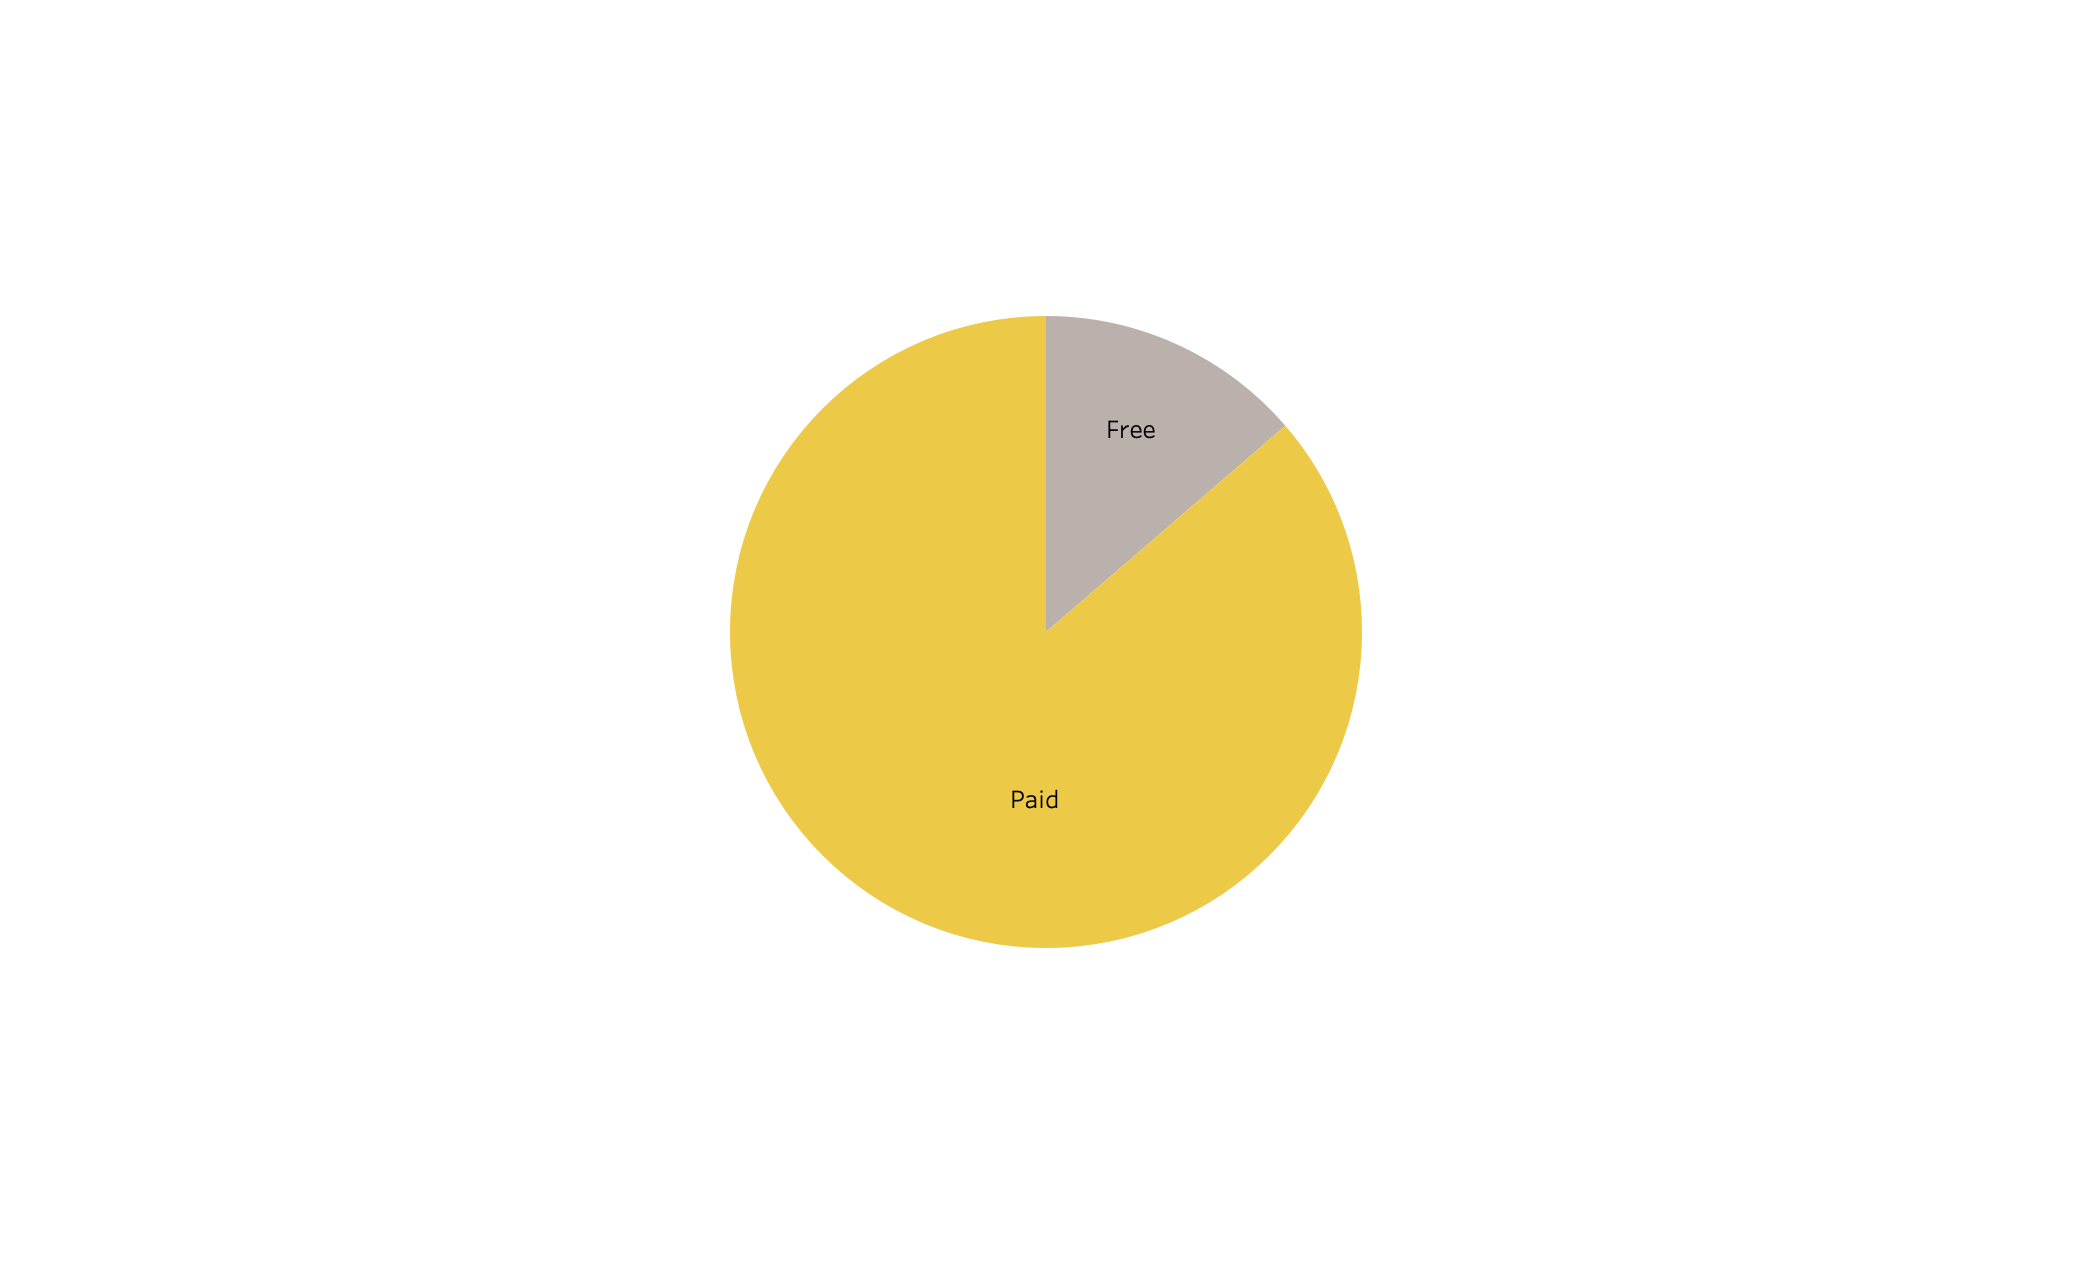
What are the most common price points?
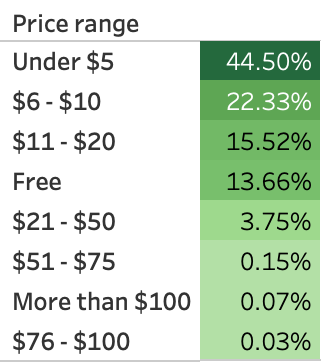
So if you make the type of game Steam users prefer playing, at a price point that Steam users are used to, there are opportunities here for financial success.
Oh, and for those of you who are curious, the most expensive game on Steam right now is a VR game that costs USD$999!
To review or not to review
It doesn’t take a rocket scientist (why does it always have to be a rocket scientist) to quickly realize that with the huge amount of games constantly being released, discoverability is our number one challenge on Steam. No amount of marketing “tricks” is going to convince people to play a game that they don’t enjoy (unless they really, really hate themselves). So we need to make games that players are likely to enjoy. And reviews are a great way to analyze that.
So what kind of variance do we see with the number of reviews games get?
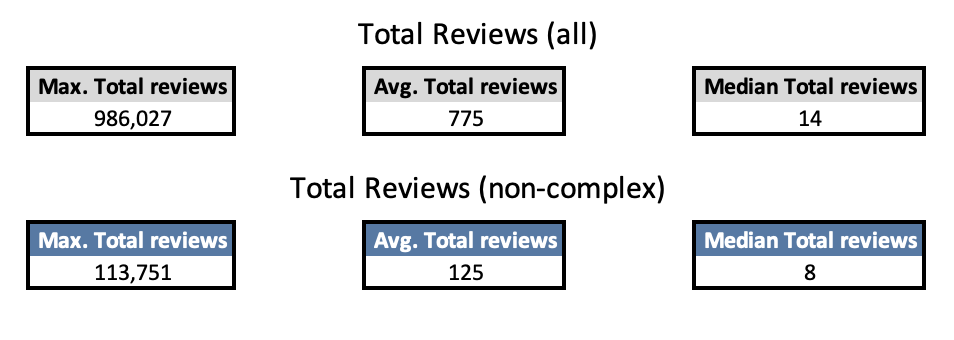
For all games:
- The highest number of reviews for a game is 986,027
- The average number of reviews is 775
- The median number of reviews is 14
Adding the secret sauce, for non-complex games:
- Highest number of reviews is 113,751
- Average is 125
- Median is 8
The above figures are a great example of the dangers of only looking at averages.
They also show us that Steam users generally prefer playing complex games.
While all the above figures are interesting, what if we group them into buckets of review numbers? If we do that, we see that the vast majority of games have less than 50 reviews.
Note with the above animation that if we only look at games that are non-complex, that bucket of < 50 reviews is even bigger. At this point, it almost looks like a dumpster…
Simply put, there are many games that disappear into the abyss on Steam and may never be found. Sometimes, a lucky one emerges from this forgotten pile and becomes a smash hit and an enduring cultural moment. Among Us is a great example of that. Released in 2018, it was unknown until mid-2020 when, fuelled by the pandemic and a bunch of well-known streamers, it broke through to become a surprise hit.
But exceptions like this aside, what I didn’t show in the above visualizations is that a whopping 17% of games don’t have any reviews at all (insert sad trombone sound effect). That is something to ponder.
But sometimes even trombones get their moment on Steam.
I digress.
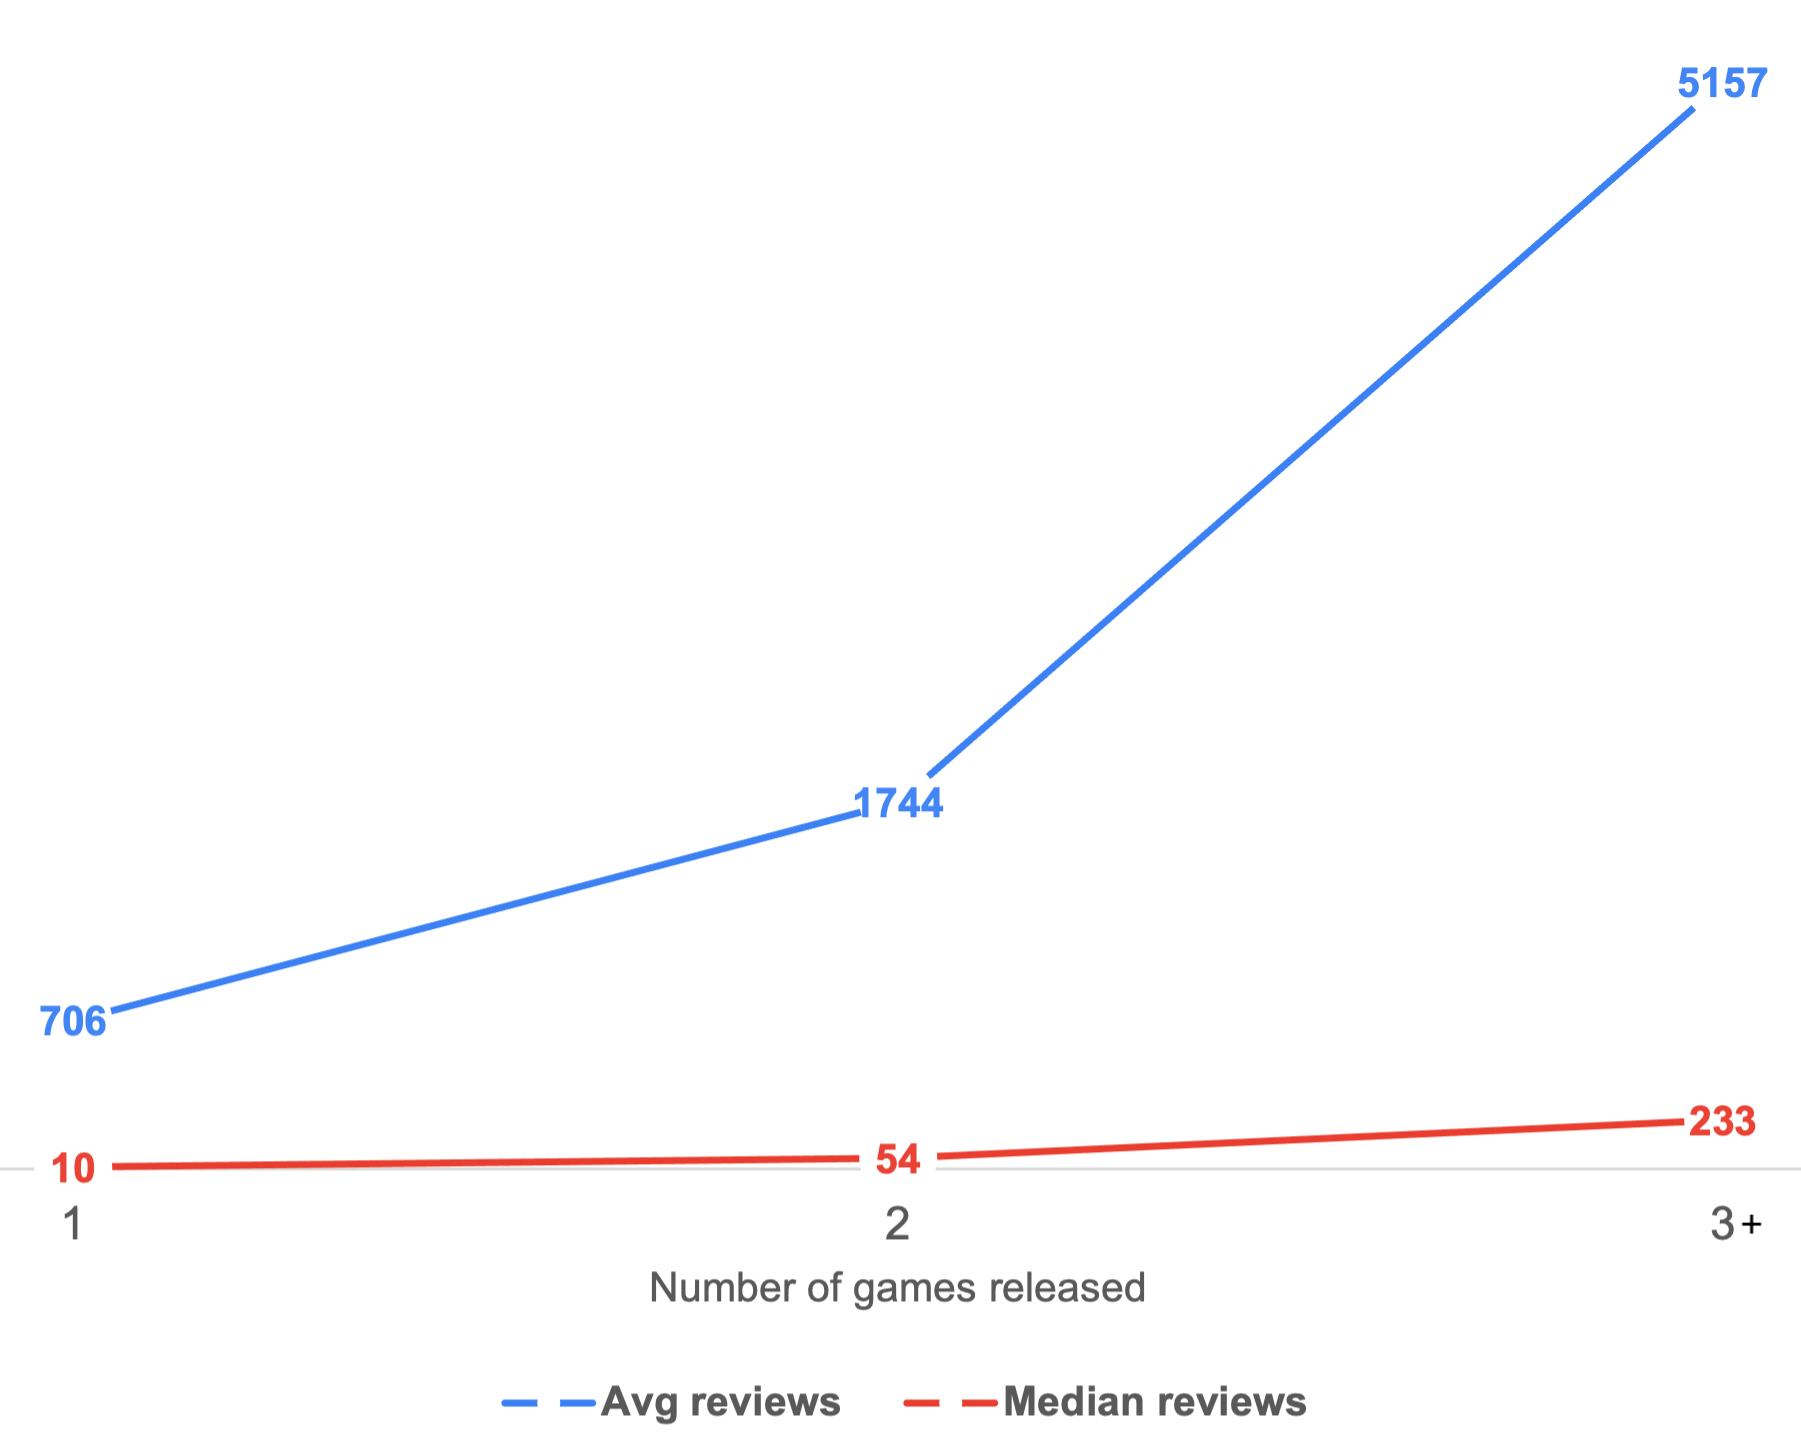
If you make a game that gets few reviews, I urge you not to give up. While you might eventually get lucky (if your game is high quality like Among Us), my analysis shows that the more games you release, the more you increase your chances of success:
Now it’s time to look at the two main data points that will give us an idea of what game to actually make.
Genres… not as useful as you’d think
On Steam, games can be labeled with zero or more genres. These labels help with discoverability on the platform.
There are a dozen or so genres in the Steam data set. In general, genres are a poor way to classify games these days, as they are not very descriptive, and games have dramatically evolved over time to defy simplistic classification such as “action” or “adventure”.
But with that said, let’s take a look at the data. The visualization below shows all the genres and the median number of reviews for games in that genre, while the colour of the bar represents the average complexity of games in that genre. The less complex games are, the more green that bar will be.
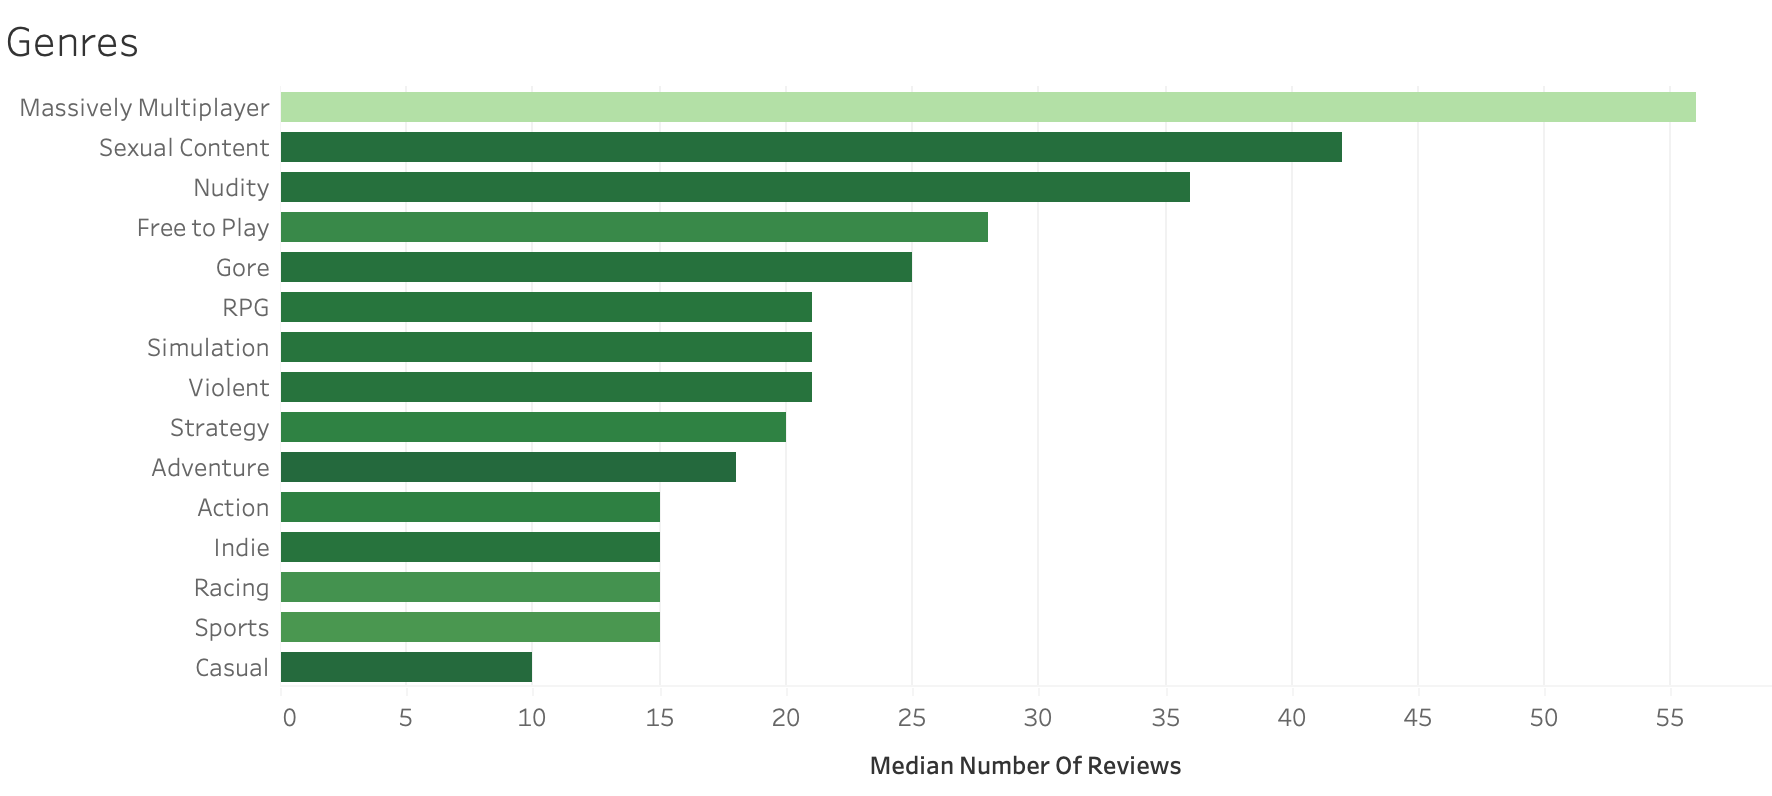
Perhaps surprisingly, adult content plugs two of the top three spots. But not surprisingly, the most popular genre is Massively Multiplayer (MMO). Also not surprisingly, MMO games are some of the most technically complex games on the market.
But the above shows data for all the years in the Steam data set. Let’s zero in on the two most recent complete years: 2021 and 2022. For games released during these two years, here are the most popular genres:
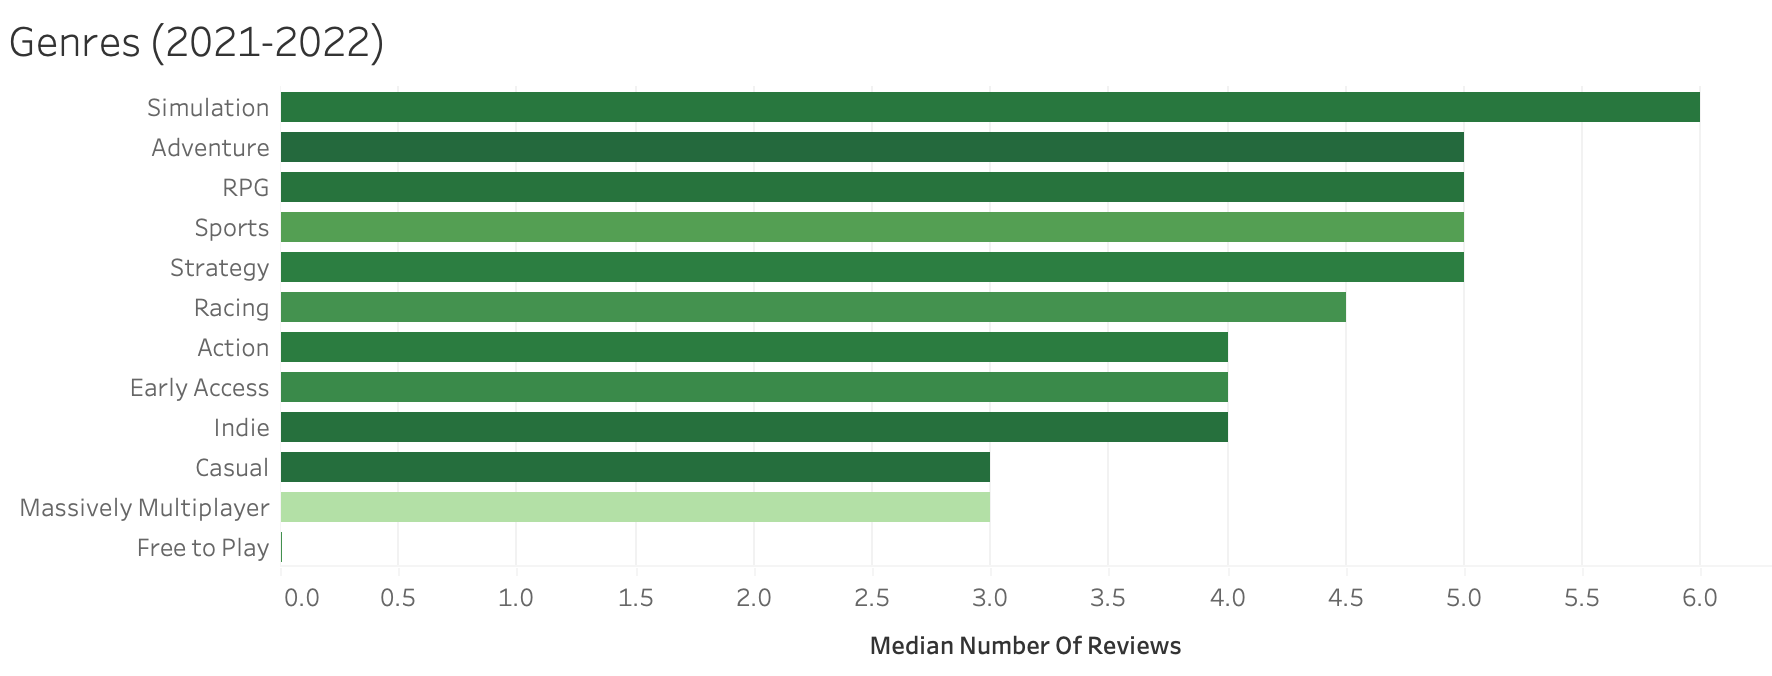
Here we see another reason genres aren’t a useful way to decide what game to make. Almost all the genres in 2021-22 have similar median review numbers – and they’re all very low and show little variance.
As a note of interest: the huge drop in median reviews for MMO games in the above visualization is likely due to players having committed themselves to their favourite MMO from earlier years already. After all, playing open world MMOs is a large commitment. Players don’t want to lose the progress they have made over the years, and due to the nature of the genre (and network effects in general), they are likely playing with friends – making it even less likely they will abandon the game to try a brand new MMO.
So if genres aren’t a good way to help us decide what game to make, what do we focus on instead?
Tags, tags, everywhere
Just like genres, a game can be labelled with zero or more tags. Even at face value, tags feel more useful already. There are over 400 different tags in the Steam data set. Tags often combine terms related to genres, game mechanics, game styles, game art, and other attributes that are more descriptive than a genre can ever be.
So, just like with the analysis of genres, let’s immediately zero in on an analysis of tags for games released in 2021 and 2022:
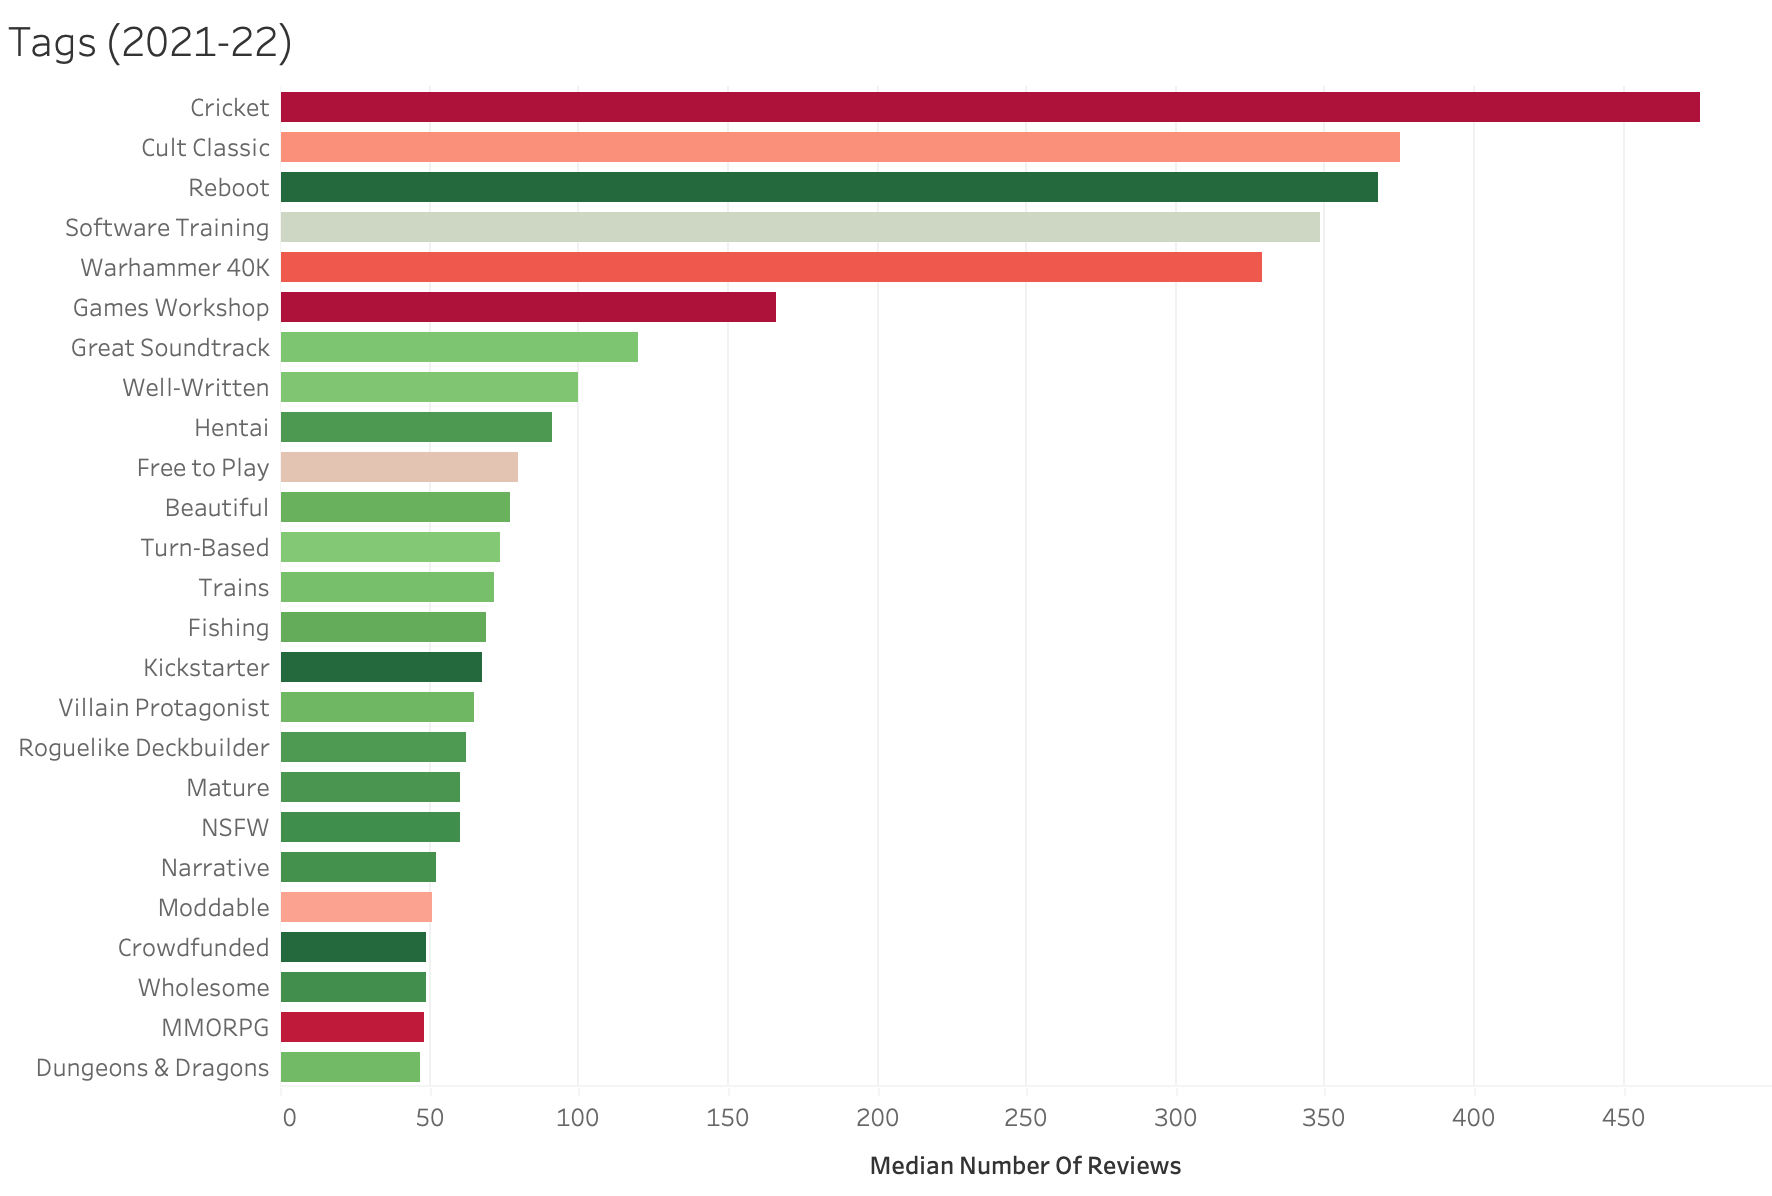
(If you’d like to explore all 400+ tags, just click on the above image to interact with the visualization on Tableau Public.)
This is more insightful already.
For one, who would have thought cricket would have the highest number of median reviews! But that’s because there are only two games with that tag.
Fun fact though: during a real life game of cricket, there will be over 160+ new games released on Steam.
But ignoring cricket, looking at tags that are some version of green (and therefore lower complexity on average), and have 50 or more median reviews, the above visualization shows us what kind of games we can make to increase our chances of success! Huzzah!
Right, so what game should I make?
Obviously, a well-written, wholesome, narrative game where the hero is a nude train-driving villain who likes fishing.
Oh, and it has to have a great soundtrack.
But all jokes aside, I hope all the above visualizations give you some actionable insights on the Steam ecosystem and the types of games Steam users prefer.
Game development (although “easier” than it used to be) is still a very challenging endeavour full of risk and uncertainty. So any actionable info that can help us indie game developers reduce that risk and uncertainty is worth considering.
Who knows – maybe one day many of us will be playing your next game!
Appendix
Useful resources
There are some great resources that dive further into Steam-related data:
Chris Zukowski – leverages insights from his own, in-depth game consulting experience. Chris writes extensively about how to market indie games on Steam. He also offers some excellent paid courses I highly recommend.
SteamDB – a website that continuously tracks all sorts of data points from Steam, including price history, estimates of lifetime player count and concurrent users, as well as interesting metadata on each game in the Steam database.
VG Insights – a video game market research platform that provides indie developers and publishers with market data. VG Insights uses the Steam API, along with other 3rd party data sources (such as the The Internet Game Database IGDB and others) to provide estimates on things like sales revenue, number of sales, etc. While some of the info is free, the more in-depth stuff requires a paid subscription.
AAA publishers exclusion list
Here are the publishers I excluded from my data analysis:
- 2K
- Activision
- Amazon
- Bandai Namco
- Bethesda
- Bungie
- Capcom
- CD Projekt Red
- Codemasters
- Electronic Arts
- Epic Games
- FromSoftware
- Koei Tecmo
- Konami
- Krafton
- Microsoft
- NCSoft
- NetEase
- Netmarble
- Nexon
- Paradox Interactive
- PlayStation
- Rockstar
- Sega
- Sony
- Square Enix
- Tencent
- THQ
- Ubisoft
- Valve
- Wargaming
- Warner Bros
- Xbox
SQL examples
In total, I wrote over sixty SQL queries during my analysis of the Steam data set. Here are six of my favourite SQL queries:
/*
This query identifies each game as either complex to make, or non-complex,
based on my own knowledge of game dev and the complexity of developing the
features listed in the categories column. The categories column contains a
comma-separated list of values. The query below writes values of ‘Y’ or ’N’
to a new column I created in the database.
*/

UPDATE games
SET is_complex = CASE
    WHEN
    	categories ILIKE '%Co-op%'
    	OR categories ILIKE '%Cross-Platform Multiplayer%'
    	OR categories ILIKE '%In-App Purchases%'
    	OR categories ILIKE '%Includes level editor%'
    	OR categories ILIKE '%Includes Source SDK%'
    	OR categories ILIKE '%LAN Co-op%'
    	OR categories ILIKE '%LAN PvP%'
    	OR categories ILIKE '%MMO%'
    	OR categories ILIKE '%Mods%'
    	OR categories ILIKE '%Mods (require HL2)%'
    	OR categories ILIKE '%Multi-player%'
    	OR categories ILIKE '%Online Co-op%'
    	OR categories ILIKE '%Online PvP%'
    	OR categories ILIKE '%PvP%'
    	OR categories ILIKE '%Remote Play on Phone%'
    	OR categories ILIKE '%Remote Play on Tablet%'
    	OR categories ILIKE '%Remote Play on TV%'
    	OR categories ILIKE '%Remote Play Together%'
    	OR categories ILIKE '%Shared/Split Screen%'
    	OR categories ILIKE '%Shared/Split Screen Co-op%'
    	OR categories ILIKE '%Shared/Split Screen PvP%'
    	OR categories ILIKE '%Steam Trading Cards%'
    	OR categories ILIKE '%Steam Turn Notifications%'
    	OR categories ILIKE '%Steam Workshop%'
    	OR categories ILIKE '%SteamVR Collectibles%'
    	OR categories ILIKE '%Tracked Controller Support%'
    	OR categories ILIKE '%Tracked Motion Controller Support%'
    	OR categories ILIKE '%Valve Anti-Cheat enabled%'
    	OR categories ILIKE '%VR Only%'
    	OR categories ILIKE '%VR Support%'
    	OR categories ILIKE '%VR Supported%'
    THEN 'Y'
    ELSE 'N'
END;
/*
This Common Table Expression (CTE) excludes all games published by AAA
publishers that I have defined in a separate table (excluded_publishers).
Adding this CTE to the top of any other query allowed me to ensure my
analysis was only being done on games that were not published by
AAA publishers.

The publishers field sometimes contains more than one value, hence my
approach below.
*/

WITH filtered_games AS (
  SELECT *
  FROM games
  WHERE NOT EXISTS (
    SELECT *
    FROM excluded_publishers
    WHERE games.publishers ILIKE '%' || excluded_publishers.aaa_publisher || '%'
  )
)
/*
This query counts the number of games released by each developer, then ranks
them into a top 10. I used RANK (instead of solely relying on LIMIT) in case
there were multiple developers with the same number of releases.

The query also includes the average and median number of reviews per developer.
*/

SELECT developers,
  COUNT(*) AS count_games,
  RANK() OVER (ORDER BY COUNT(*) DESC) AS rank,
  ROUND(AVG(positive + negative)::numeric, 0) AS avg_number_of_reviews,
  PERCENTILE_CONT(0.5) WITHIN GROUP (ORDER BY positive + negative) AS median_number_of_reviews
FROM filtered_games
GROUP BY developers
ORDER BY count_games DESC
LIMIT 10;
/*
Using additional Common Table Expressions (CTEs), this query calculates
the percentage of developers that have released 1 game, 2 games, or 3+ games.

The query also shows the average and median number of reviews per number
of games released.
*/

WITH game_counts AS (
  SELECT developers, COUNT(*) AS count_games
  FROM filtered_games
  GROUP BY developers
),
total_counts AS (
  SELECT COUNT(DISTINCT developers) AS total_counts FROM games
),
review_counts AS (
  SELECT developers, SUM(positive + negative) AS total_reviews
  FROM filtered_games
  GROUP BY developers
)

SELECT
  CASE
    WHEN count_games = 1 THEN '1'
    WHEN count_games = 2 THEN '2'
    ELSE '3 or more games released'
  END AS count_games_released,
  COUNT(*) * 100 / total_counts.total_counts AS percent_of_developers,
  ROUND(AVG(total_reviews)::numeric, 0) AS avg_total_reviews,
  PERCENTILE_CONT(0.5) WITHIN GROUP (ORDER BY total_reviews) AS median_total_reviews
FROM game_counts
JOIN total_counts ON 1=1
JOIN review_counts USING(developers)
GROUP BY count_games_released, total_counts.total_counts
ORDER BY percent_of_developers DESC;
/*
This query categorizes the number of games sold at various
price point ranges and then converts that to percentages of all games.

The query also shows the average and median number of reviews for
each price point.
*/

SELECT
  CASE
    WHEN price = 0 THEN 'Free'
    WHEN price <= 5 THEN '$0 - $5'
    WHEN price <= 10 THEN '$6 - $10'
    WHEN price <= 20 THEN '$11 - $20'
    WHEN price <=50 THEN '$21 - $50'
    WHEN price <=75 THEN '$51 - $75'
    WHEN price <=100 THEN '$76 - $100'
    ELSE 'More than $100'
  END AS price_category,
  ROUND(COUNT(*)::numeric / (SELECT COUNT(*) FROM games) * 100, 2) as percent,
  ROUND(AVG(positive + negative)::numeric, 0) AS avg_number_of_reviews,
  PERCENTILE_CONT(0.5) WITHIN GROUP (ORDER BY positive + negative) AS median_number_of_reviews
FROM filtered_games
GROUP BY price_category
ORDER BY 2 DESC;
/*
This query splits the comma-separated tags field into a new column
and calculates the average and median number of reviews per tag.

The query also averages the level of complexity of all games in each
tag, and the HAVING clause then filters the results to only show
games with median reviews >= 50 and complexity score <= 50
*/

SELECT
  tag,
  ROUND(COUNT(*)::numeric / (SELECT COUNT(*) FROM games) * 100, 2) AS percent,
  ROUND(AVG(positive + negative)::numeric, 0) AS avg_number_of_reviews,
  PERCENTILE_CONT(0.5) WITHIN GROUP (ORDER BY positive + negative) AS median_number_of_reviews,
  ROUND((SELECT AVG(CASE WHEN is_complex = 'Y' THEN 1 ELSE 0 END) FROM games WHERE tag = ANY(string_to_array(tags, ','))) * 100, 2) AS avg_complexity_score
FROM filtered_games, UNNEST(string_to_array(tags, ',')) tag
GROUP BY tag
HAVING PERCENTILE_CONT(0.5) WITHIN GROUP (ORDER BY positive + negative) >= 50 AND ROUND((SELECT AVG(CASE WHEN is_complex = 'Y' THEN 1 ELSE 0 END) FROM games WHERE tag = ANY(string_to_array(tags, ','))) * 100, 2) <= 50
ORDER BY avg_complexity_score DESC;